Chapter I :
What are Candle Sticks ??
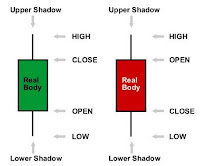
Every Stock which Moves up and down ..that means the prices moving up and down have four important values....These are Open , High ,Low and Close (OHLC). based on TF (Time Frame) which can be 5 min time frame, 15 min 30 min 1 Hr , 4 Hr, Daily , weekly or Monthly.
Usually for EOD (end of day) analysis we analyse Daily candle stick formation.
The Chart formed with Candlesticks are called as Candlestick Chart
The graphical representation is as below.>>
Similarly the Prices OHLC can be represented in Bar form:The chart formed with Bars are called as Bar chart.


What are Candle Sticks ??
Every Stock which Moves up and down ..that means the prices moving up and down have four important values....These are Open , High ,Low and Close (OHLC). based on TF (Time Frame) which can be 5 min time frame, 15 min 30 min 1 Hr , 4 Hr, Daily , weekly or Monthly.
Usually for EOD (end of day) analysis we analyse Daily candle stick formation.
The Chart formed with Candlesticks are called as Candlestick Chart
The graphical representation is as below.>>


Lets see the comparison in Pictorial format>>

So Basically Candle sticks or Bars represents the Price action of a particualar TF.(time frame)
Time frame indicates the time to form a candle ,it can be 1 min ,2 min,5 min,10 min 15min,30 min,1 hr....2he,4 hr,8 hr...daily weekly or monthly candle.............Every timeframe candle will have OHLC.

Now depending on the bullish and bearish scenario or to infer from the candle next move whether it will be bullish or bearish different candle formation happens, depending on demand and supply.
So if the supply is more then Red Candle (BEarish candle formation ) if demand is more then the candle will be green.
So each candle will have OHLC (open,high,low and close)
Many a times it happens that the body of candle contains O=H or O=L
O=C or L=C.
So accordingly a candle will form.
Now based on the above fact there will beIt is characterized by being small in length—meaning a small trading range—with an opening and closing price that are virtually equal. different candles like (DOJI), HAMMER/Inverted HAmmer....shooting star.....Morning star......Bullish engulfing, Bearish Engulfing..Peircing pattern.......Three white solders..Three Black Crows ..Dark cloud formation.....Three Buddha PAttern and so on.
THE DOJI
Doji is the most powerful candle: One can interpret from it whether there will be reversal in trend .
It the trend is positive and a Doji is formed at the top then it is considered as trend reversal.However it is not necessary that the trend will change only.Next days candle formation will give us confirmation that the trend is changed.
What is DOJI
A doji occurs when the opening and closing price is the same (or close to it)
The Doji is an transitional Candlestick formation, signifying equality and/or indecision between bulls and bears.
Doji is the most famous candlestick among all different kinds of candlesticks and DojiStar is the most famous Doji pattern
The Doji is one of the most revealing signals in Candlestick trading. It clearly indicates that the bulls and the bears are at an equilibrium, a state of indecision


More will come .....OI...PE ratio ....all will come in this blog only Just need your encouragement and Just login as a member...Sign in...so i will come to know who all are interested.
ReplyDeleteWOW THATS GREAT, I M FOLLOWING YOUR BACK AND LEARNING, IT IS HELPFUL IF POST ARTICLES ON OI,PE RATIO
DeleteGood Initiative
ReplyDeleteNice Initiative.
ReplyDeleteSuperb sir ji
ReplyDeleteSure!
ReplyDeleteThanks Will update this thread
ReplyDelete